
Why Bitcoin May Crash Below $20,000 Soon
Predicting Bitcoin’s Price Through Historical Data
Historical trends and data points often shed light on potential future movements, especially in the volatile world of cryptocurrencies. September, based on our comprehensive analysis, traditionally poses challenges for Bitcoin, the leading digital currency.
In September 2022, Bitcoin experienced a decrease of -3.09%. This decline was the most notable for a September month since the year 2014. Projecting forward, if 2023 follows this previous trend, we can anticipate the cryptocurrency to touch around the $25,107 mark by the close of the month. However, widening our lens to account for an average September decline, which sits at roughly -9.22% over the considered years, this figure might recede even further to approximately $23,530.
Amplitude analysis serves as another tool to gauge the potential future trajectory of Bitcoin. Revisiting the data from September 2018, a standout month with the lowest amplitude since 2014 (with the exclusion of 2015 and 2016 due to their respective price increases), Bitcoin’s price underwent a fluctuation of about 19.51%. Taking into account the current month’s opening price of $25,927, should Bitcoin tread the amplitude path of 2018, a downward spiral to a figure around $20,867.67 is conceivable. Current market conditions, which many analysts view as unfavorable, inject a layer of uncertainty to Bitcoin’s near-term outlook.
Diving deeper into historical amplitude patterns, the average for this parameter over the years hovers around 27.21%. Based on this percentage, a plausible scenario might see Bitcoin nearing a concerning valuation of $18,860 in the foreseeable future.
Technical Analysis
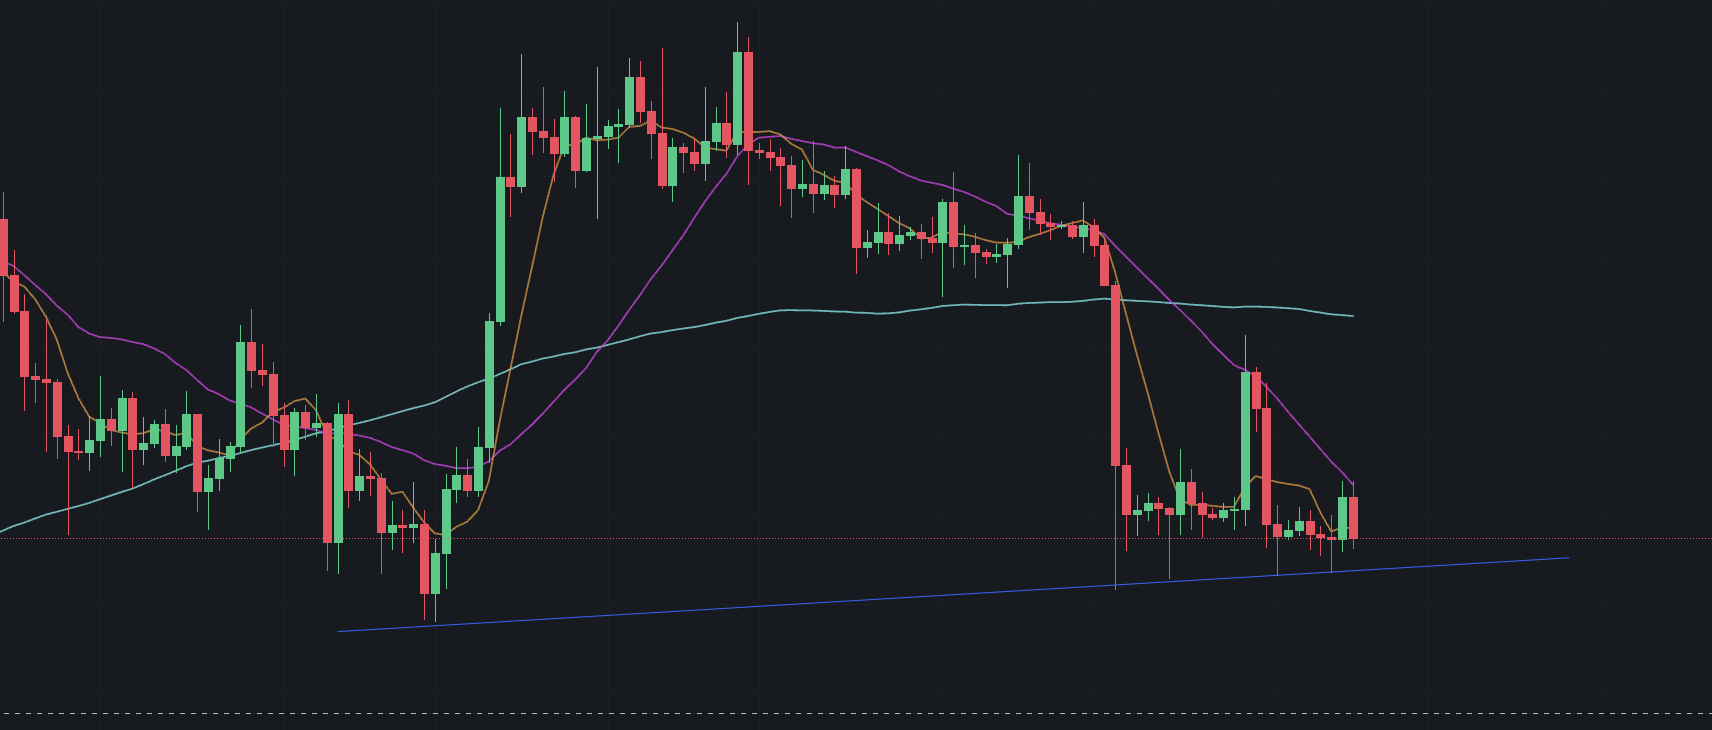
Bitcoin’s price trends remain under intense scrutiny by both traders and investors. Currently, its value hovers around the $25,800 mark. A notable setback from the bullish momentum of the 10-daily moving averages emphasizes the significance of the $26,000 support level for Bitcoin. This threshold is pivotal for traders; any falter here could trigger an downtrend.
Source: Binance
Adding to the intricacies is the crucial $25,000 support line. Bitcoin has displayed commendable tenacity since August 17th, consistently staying above this mark. Notably, the upward trending line for Bitcoin also converges around this $25,000 zone. Should the currency break this line, the implications could be severe. Without any clear support immediately below, Bitcoin might be vulnerable to a sharp dive, potentially spiraling down to the $20,000 range.
Given these dynamics, it’s essential for investors to remain vigilant, harnessing both historical insights and in-depth technical analysis to steer through the capricious nature of Bitcoin’s valuation.
Disclaimer & Copyright Notice: The content of this article is for informational purposes only and is not intended as financial advice. Always consult with a professional before making any financial decisions. This material is the exclusive property of Blockchain.News. Unauthorized use, duplication, or distribution without express permission is prohibited. Proper credit and direction to the original content are required for any permitted use.
Image source: Shutterstock
Comments are closed.