
Ethereum Price Analysis: Navigating the Consolidation Phase
The current uptrend in Ethereum’s price began on June 15, 2023, when the price was at a low of $1626. Following this low point, Ethereum began to rise, and by June 19, the 5-day MA crossed above the 10-day MA for the first time, signaling a bullish trend. Since this crossover, the 5-day MA, currently around $1930, has not crossed below the 10-day MA, which stands at approximately $1908. Whenever the 5-day MA has touched the 10-day MA, Ethereum’s price has bounced back, indicating that the 10-day MA is a strong support level and that Ethereum remains in an uptrend.
However, the 4-hour chart tells a different story. The highest prices for Ethereum have been progressively lower, indicating a downtrend on this timeframe. This divergence between the daily and 4-hour charts suggests that the market is at a critical juncture.
Further, bearish divergence in both the RSI and MACD on the daily chart suggests that the uptrend is losing momentum and may even reverse. These crypto trading signals strongly indicate a potential shift in market dynamics.
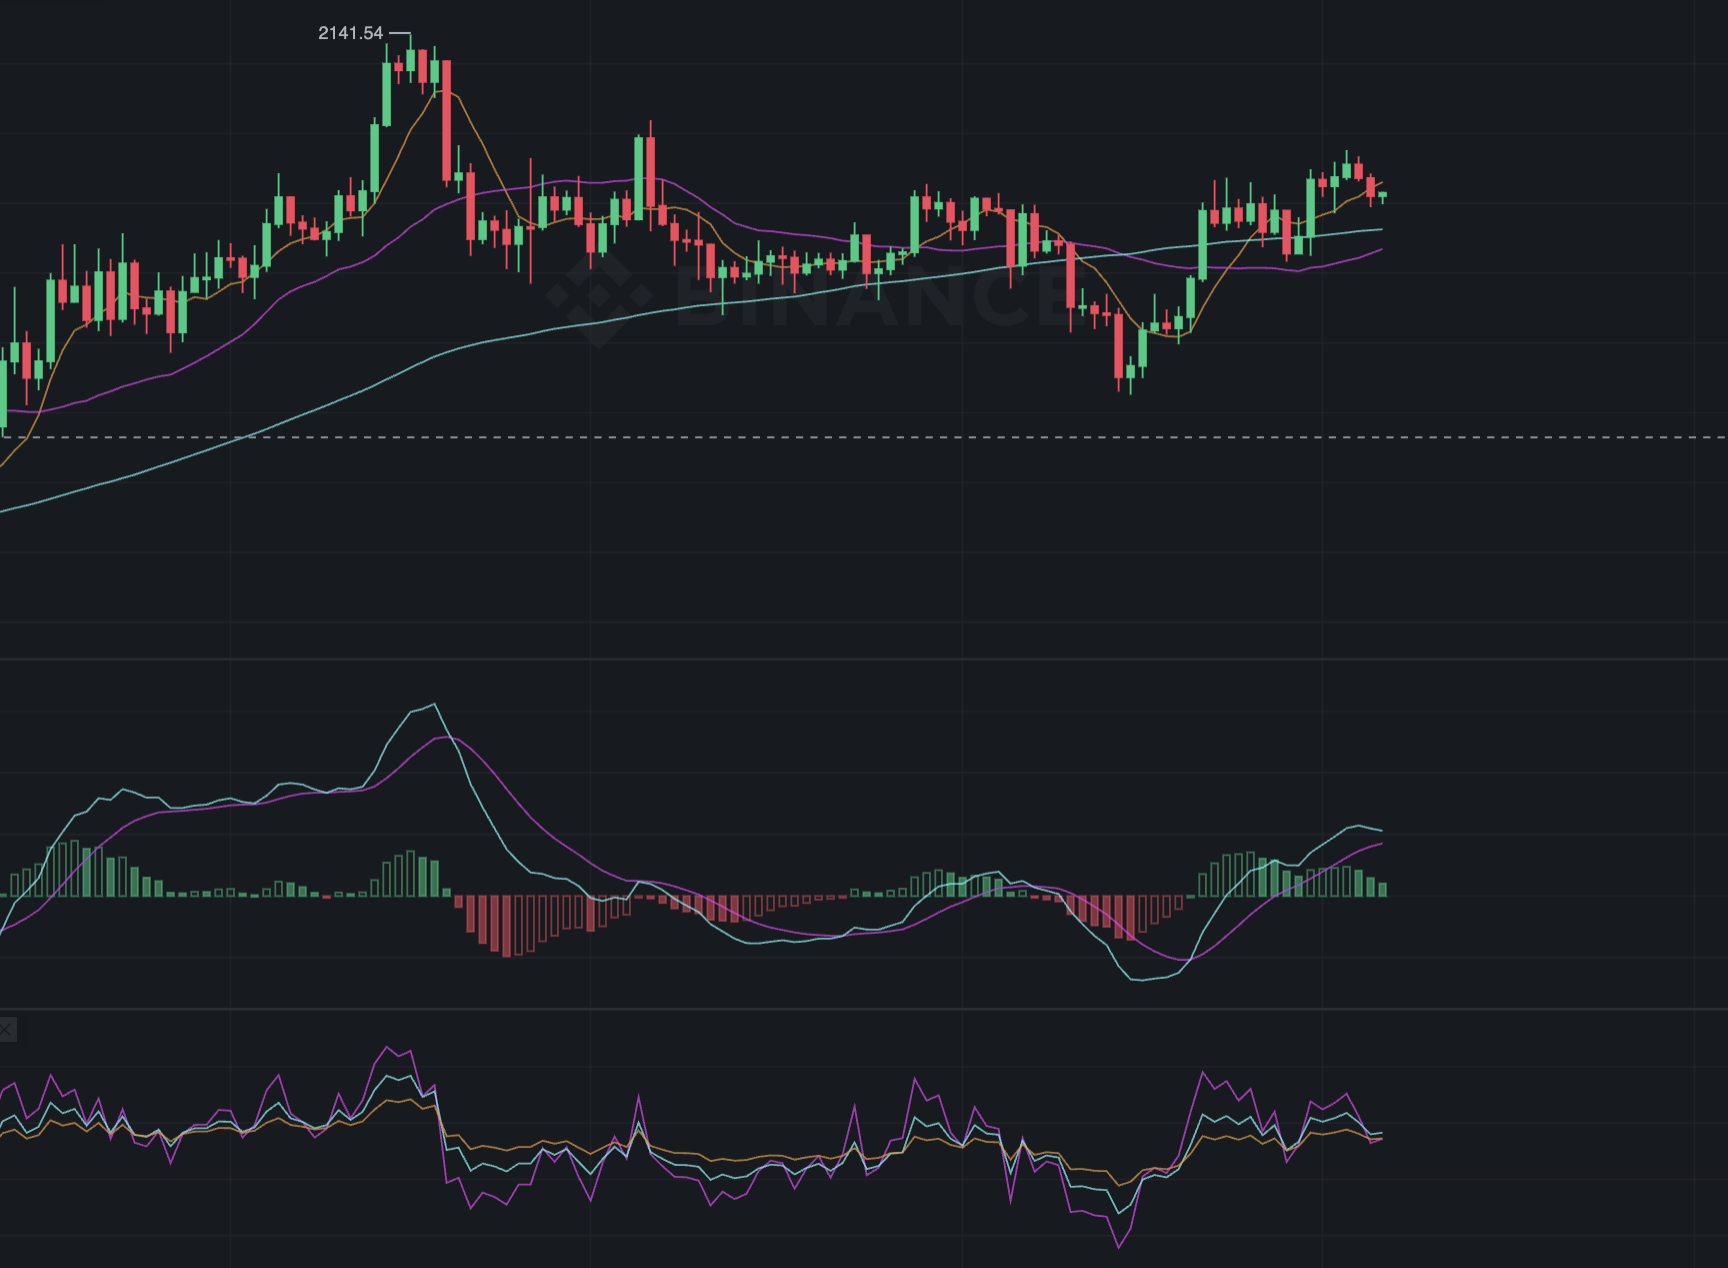
Source: Binance
As for the ETH/BTC trading pair, it has been weak recently, even as Bitcoin’s price has been in an uptrend. This suggests that Ethereum’s performance, currently priced at 0.06277 BTC, has been lagging compared to Bitcoin. At present, the ETH/BTC pair is trading below the 5-day MA but above the 10-day MA, indicating a period of consolidation.
In conclusion, our Ethereum price analysis suggests a period of consolidation with minor fluctuations, between the 10-day MA and $1937. Traders should closely monitor key support and resistance levels, currently at around $1850 and $1950 respectively, for potential breakout or breakdown scenarios. As Ethereum’s price currently stands at $1912.41, staying updated with the latest market movements is essential for making informed trading decisions
Image source: Shutterstock
Comments are closed.