
Pepe Coin Shows Bullish Indicators After an 80% Decline
Pepe coin is displaying potential signs of resurgence, after a tumultuous period characterized by an over 80% drop in value and scandals involving insider trading and scams linked to its founder. Technical indicators across different time frames hint at a possible bullish momentum for the cryptocurrency.
Technical Analysis: Both RSI and MACD Indicate Bullish Momentum
Daily Time FrameOn the daily chart, both the Moving Average Convergence Divergence (MACD) and the Relative Strength Index (RSI) are displaying bullish divergence. Such patterns typically indicate a potential reversal in price trends.
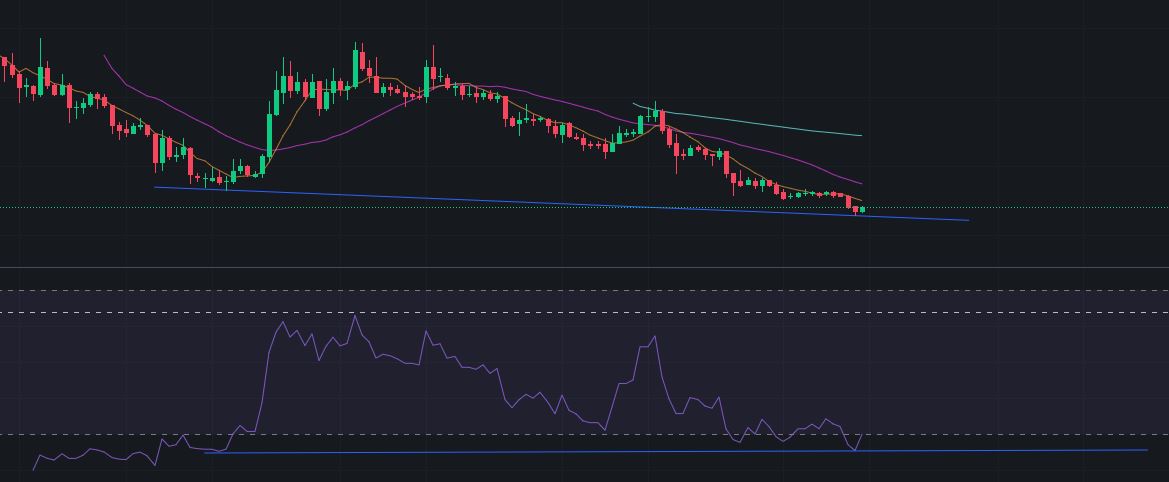
RSI Divergence, Source: Binance
A bullish RSI divergence occurs when the price of an asset makes a new low, but the Relative Strength Index (RSI) creates a higher low. This discrepancy suggests weakening downward momentum and a potential upcoming price reversal to the upside. Traders often view this pattern as a sign that the current downtrend may be losing steam, and a bullish trend could be on the horizon.
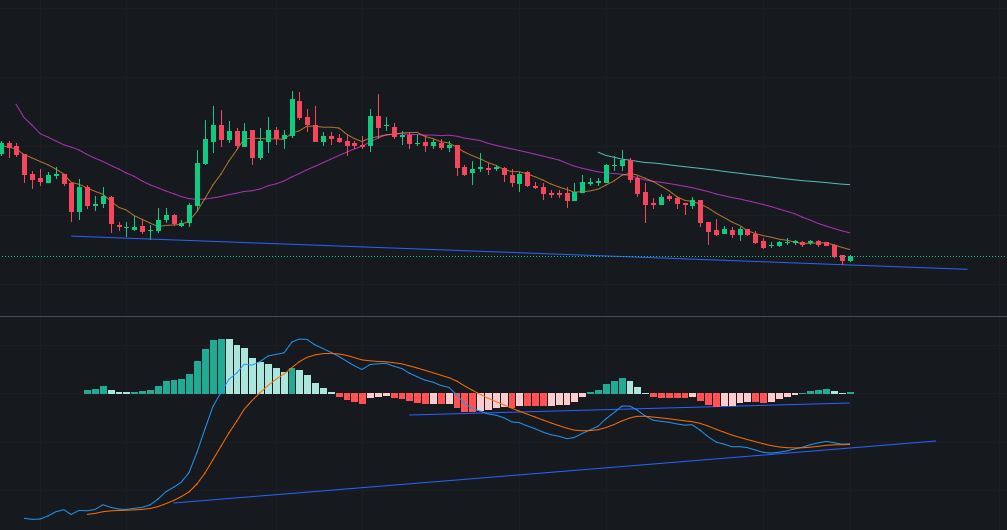
MACD Divergence, Source: Binance
1-Hour Time Frame: Similar bullish divergence patterns are also evident on the 1-hour chart, reinforcing the sentiment suggested by the daily indicators.
RSI Implications: The RSI, a momentum oscillator, is particularly noteworthy. When there’s a bullish divergence on the daily time frame, it often signifies a strong requirement for a bounce, which may not be short-lived. This could mean that Pepe coin might see a more sustained recovery in the coming days or weeks.
Pepe Coin Remains Within a Descending Channel
But please note that the Pepe coin’s price trajectory continues to be characterized by a descending channel, signaling a consistent downward trend over a period. Investors and traders should approach this with a degree of caution, as such patterns often indicate sustained bearish momentum. To shift this narrative and indicate a potential bullish turnaround, the price would need to achieve a significant milestone: breaking above the descending channel.
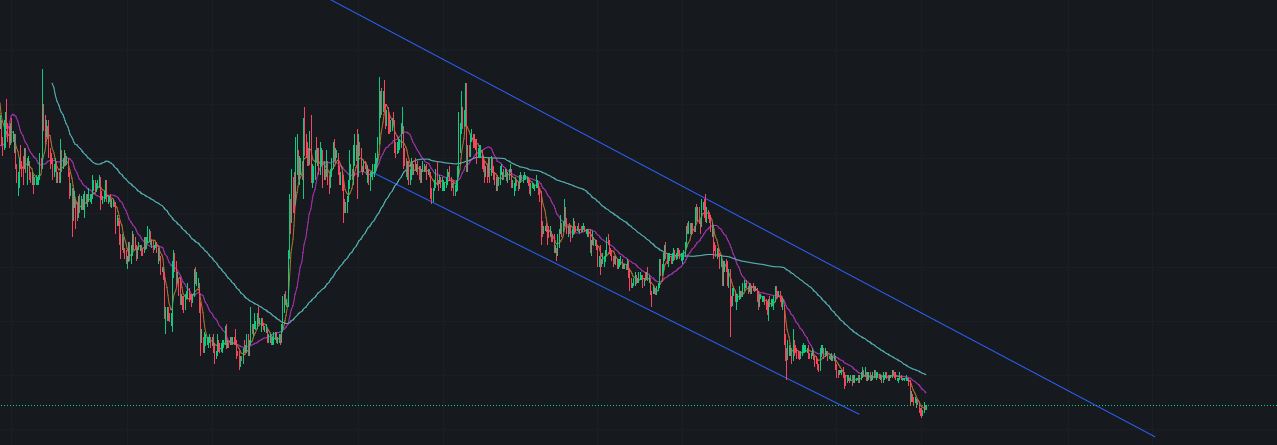
Descending Channel, Source: Binance
More importantly, after surpassing this boundary, it’s crucial for the coin to maintain its position and firmly establish itself above the upper boundary of the channel. This would provide a stronger confirmation of a trend reversal, offering a more optimistic outlook for the cryptocurrency’s future performance.
While current market indicators suggest an anticipated bounce in the Pepe coin’s value, it’s essential for investors to tread with caution. As the price inches closer to the upper boundary of its descending channel, historical data and technical patterns indicate this as a potential resistance zone. In such scenarios, the upper bound often acts as a ceiling, making it challenging for the asset to break through. Given this, for investors aiming to maximize returns and minimize potential downturns, it might be a strategic move to consider selling or reducing their holdings as the price approaches this critical threshold.
A crucial caveat to consider is that if Bitcoin experiences a downturn, most other coins, including Pepe, are likely to follow suit. Pepe’s potential bounce is also closely tied to Bitcoin’s future price trajectory. Furthermore, while the presence of bullish divergence is promising, there are instances where a double bullish divergence is required to reinforce a bounce, especially for coins that have witnessed significant declines.
Disclaimer & Copyright Notice: The content of this article is for informational purposes only and is not intended as financial advice. Always consult with a professional before making any financial decisions. This material is the exclusive property of Blockchain.News. Unauthorized use, duplication, or distribution without express permission is prohibited. Proper credit and direction to the original content are required for any permitted use.
Image source: Shutterstock
Comments are closed.