
Bitcoin September Curse? Predicting BTC Price Using Comprehensive Historical Data
September’s Historical Downtrend
Over the nine-year period from 2014 to 2022, Bitcoin’s September performance has largely been bearish. The closing price in September was often lower than the opening price, indicating a general downtrend for the month.
Bitcoin Price Year-by-Year Analysis
2014: Opened at $479 and closed at $391, a decline of 18.37%.
2015: Opened at $230 and closed at $236, a slight increase of 2.6%. This year is an exception to the general downtrend.
2016: Opened at $570 and closed at $608, an increase of 6.67%. Another exception to the downtrend.
2017: Opened at $4,734 and closed at $4,326, a decline of 8.62%. This year saw a significant intra-month drop of nearly 40%.
2018: Opened at $7,015 and closed at $6,597, a decline of 5.96%.
2019: Opened at $9,593 and closed at $8,298, a decline of 13.49%.
2020: Opened at $11,658 and closed at $10,778, a decline of 7.55%.
2021: Opened at $47,118 and closed at $43,834, a decline of 6.97%.
2022: Opened at $20,049 and closed at $19,429, a decline of 3.09%.
Average September Decline
Excluding the two years (2015 and 2016) where Bitcoin saw an increase in September, the average decline for the remaining years is approximately 9.03%.
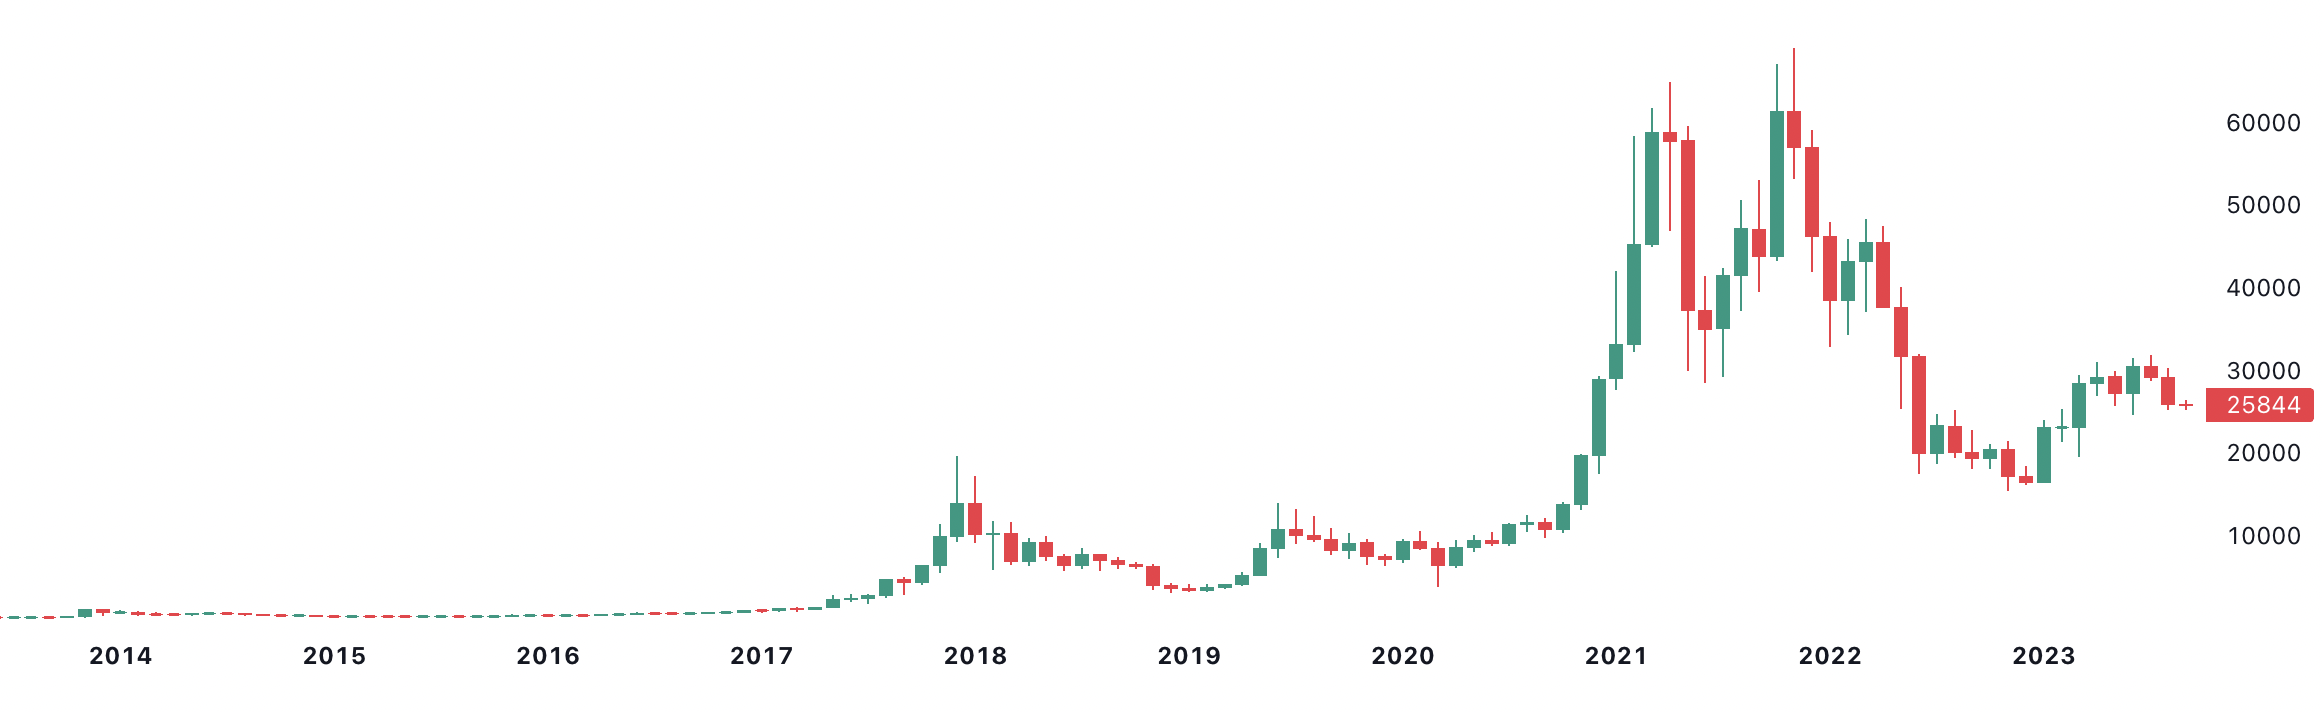
Soruce: TradingView
Year-by-Year Amplitude Analysis:
For Bitcoin, the month of September has historically been characterized by significant price fluctuations. A detailed examination of the past nine years reveals the amplitude of these price movements, providing a clearer picture of the cryptocurrency’s September behavior. Below uses formula: (High – Low) / Low.
2014: Bitcoin experienced an amplitude of 36.16%, swinging between a low of $365 and a high of $497.
2015: The amplitude was more subdued this year, recorded at 10.31%, with the price oscillating between $223 and $246.
2016: Bitcoin’s amplitude stood at 10.95%, as the price moved between $566 and $628.
2017: This year saw a dramatic amplitude of 67.43%, with Bitcoin’s price ranging from $2,973 to a high of $4,979.
2018: The amplitude was 21.62%, as Bitcoin’s price varied between $6,094 and $7,411.
2019: Bitcoin experienced a significant amplitude of 41.97%, with the price fluctuating between $7,714 and $10,949.
2020: The amplitude for this year was 22.60%, as Bitcoin’s price moved within the range of $9,825 and $12,065.
2021: Bitcoin’s amplitude was recorded at 33.81%, with prices swinging between $39,573 and $52,956.
2022: The amplitude stood at 25.47%, as Bitcoin’s price varied between $18,157 and $22,781.’
Below uses formula: (High – Low) / ( (High + Low)/2 ).
2014: The amplitude was 28.91%, with Bitcoin prices ranging between a low of $365 and a high of $497.
2015: Bitcoin’s amplitude stood at 10.14%, oscillating between $223 and $246.
2016: The amplitude for the year was 10.77%, as Bitcoin’s prices moved from a low of $566 to a high of $628.
2017: Bitcoin experienced an amplitude of 50.15%, with prices fluctuating between $2,973 and $4,979.
2018: The amplitude for the year was 20.18%, as Bitcoin’s prices varied between $6,094 and $7,411.
2019: Bitcoin saw an amplitude of 33.33%, with prices ranging from $7,714 to $10,949.
2020: The amplitude for the year stood at 20.41%, as Bitcoin’s prices oscillated between $9,825 and $12,065.
2021: Bitcoin’s amplitude was 28.28%, with prices moving between $39,573 and $52,956.
2022: The amplitude for the year was 22.22%, as Bitcoin’s prices varied between $18,157 and $22,781.
Average September Amplitude
The average amplitude for Bitcoin in September over the years 2014 to 2022 using the traditional formula is approximately 29.92%. Using the alternative formula, the average amplitude is approximately 24.91%
Current Bitcoin Data
Bitcoin kicked off September 2023 with an opening price of $25,927. Despite reaching a monthly high of $26,429, the cryptocurrency experienced a dip, recording a low of $25,333. At the time of writing, Bitcoin is trading at $25,850.
As September progresses, Bitcoin, market analysts have projected potential low points for Bitcoin by the close of September.
Predicting the Future Based on Historical Trends
Historical Declines: Delving into past performances, Bitcoin’s most pronounced September decline was -3.09% in 2022. If 2023 mirrors this trend, Bitcoin could potentially settle around the $25,107 mark by month-end.
The average decline over the years hovers at approximately -9.22%. If this average is indicative of this year’s performance, Bitcoin might conclude September near $23,530.
Amplitude Analysis: Utilizing the alternative amplitude formula, Bitcoin’s amplitude for September 2018 was discerned to be approximately 19.51%. The most restrained September amplitude was recorded in 2015 at 10.31%. If this month’s price movements align with this subdued amplitude, predominantly in the downward trajectory, Bitcoin’s valuation could diminish to $23,240 by the end of September.
Factoring in the average amplitude over the years, which stands at approximately 27.21%, a worst-case scenario could see Bitcoin descending to a concerning $18,860 by month’s close.
However, Bitcoin’s price has the potential to defy historical trends and close September above $25,927, akin to the positive performances observed in 2015 and 2016.
While these projections provide a lens into historical trends, the inherently volatile nature of cryptocurrencies suggests that actual outcomes may vary. Investors and traders are advised to exercise prudence and remain abreast of market developments.
Disclaimer & Copyright Notice: The content of this article is for informational purposes only and is not intended as financial advice. Always consult with a professional before making any financial decisions. This material is the exclusive property of Blockchain.News. Unauthorized use, duplication, or distribution without express permission is prohibited. Proper credit and direction to the original content are required for any permitted use.
Image source: Shutterstock
Comments are closed.